
.webp)


A Guide to Benchmarking Fixed LPR Solutions
By tapping ‘Submit', you are agreeing to Flock Privacy Notice.
Step 1: Define Your Success Metrics
Before beginning your trial, clearly define what success looks like for your organization. While many vendors offer advanced LPR solutions, their approaches to vehicle recognition, data integration, deployment, and ecosystem design often differ. Center your evaluation on these key areas:
- Plate Read Accuracy & Vehicle Identification: Which system delivers more accurate reads and reliably identifies details such as make, color, and unique features?
- Ease of Use & Workflow Integration: How intuitive is the software for searching, analyzing, and sharing data across teams and agencies?
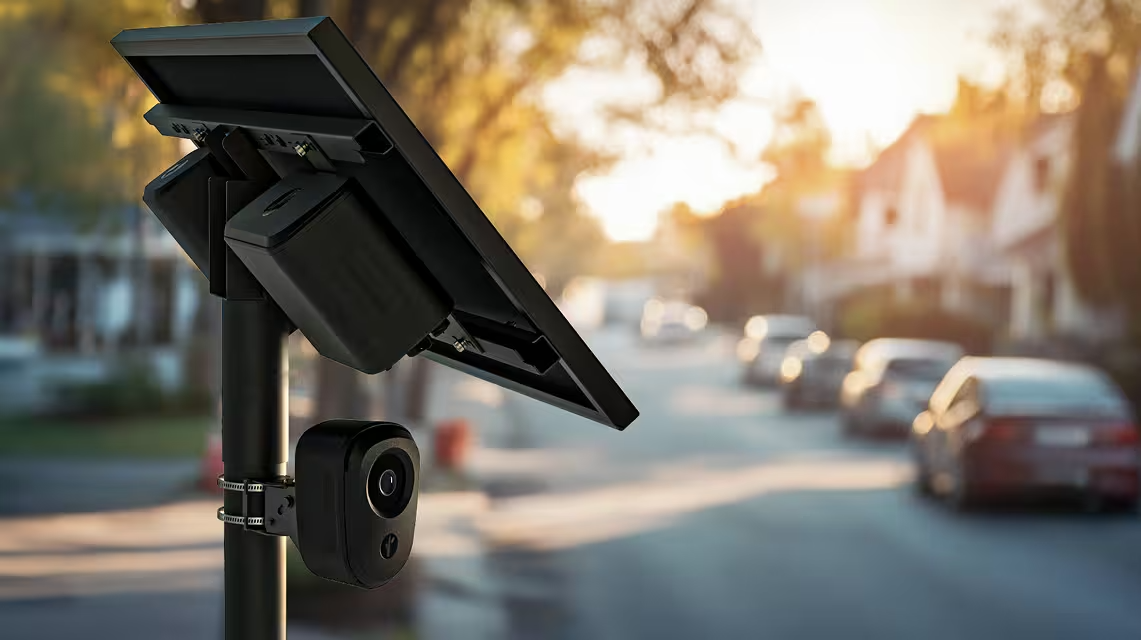
- Deployment & Maintenance: Considering power, connectivity and support, which solution offers the more efficient, cost-effective model for deployment and upkeep?
A Closer Look: How LPR Systems Work
Modern LPR systems capture and analyze vehicle data to generate actionable intelligence. The process works in three key steps:
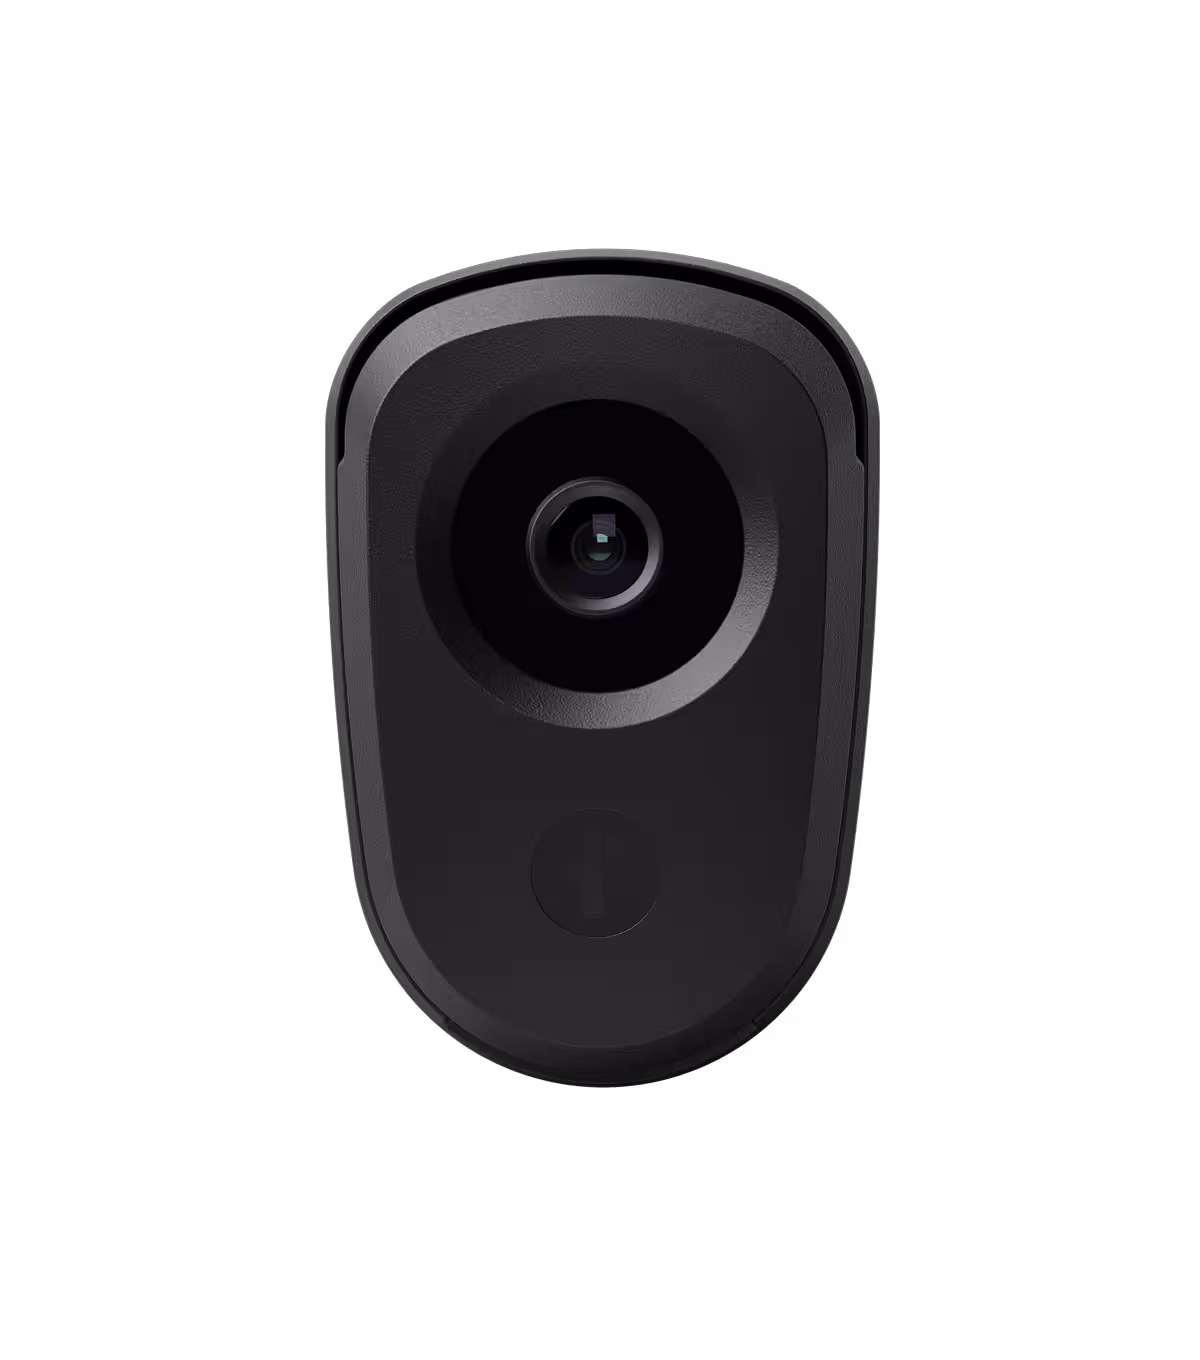
- Image Capture: High-resolution cameras capture images of vehicles and license plates 24/7.
- Data Analysis: Software powered by optical character recognition (OCR), AI and machine learning reads the plate and identifies details like make, body type, color, condition, and other distinguishing markers.
- Alerts & Investigations: Captured data is checked against hotlists, triggering alerts when matches occur. All data is stored in a searchable database to support investigations.
Step 2: Identify Key Testing Criteria
A focused trial will deliver the most valuable insights. Prioritize the following areas:
Hardware Performance
- Image Quality: Test plate legibility and image clarity across conditions (day, night, weather, glare).
- Read Accuracy: Measure capture rate and accuracy at varying vehicle speeds and across plate types (standard, temporary, vanity).
- Vehicle Recognition: Evaluate how reliably the system identifies make, color, and unique features (e.g., roof racks, bumper stickers).
Software & Analytics
- Search: Test ease and speed when searching by full, partial, or missing plates, as well as temporary or out-of-state plates and vehicle characteristics.
- Data Sharing: Review inter-agency sharing workflows. Many vendors require one-off agency-to-agency agreements; Flock offers a simple opt-in to its nationwide network.
- Reporting: Evaluate the depth and usability of analytics and reporting tools.
Implementation & Support
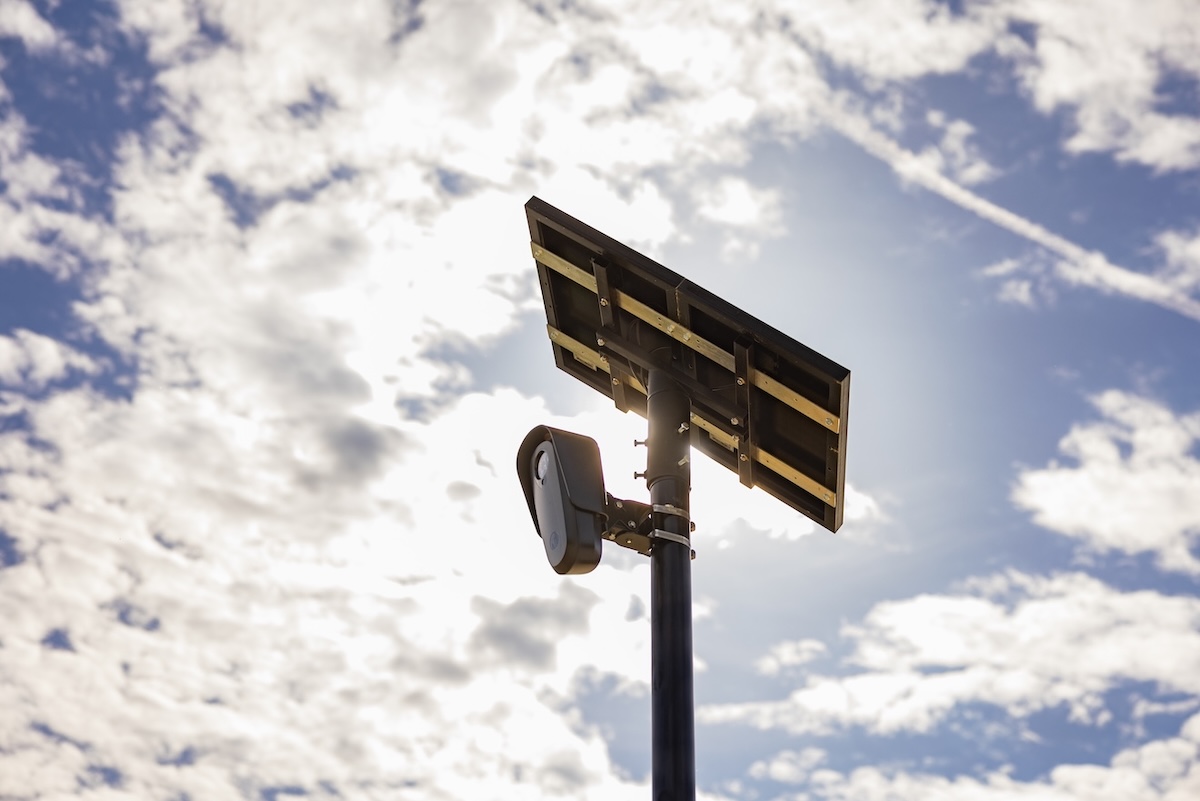
- Deployment: Compare the permitting and installation processes. Flock’s subscription includes cellular connectivity, permitting and installation; others may require hardware purchase and third-party integrators.
- Maintenance: Clarify responsibilities for maintenance, repairs, and updates. Flock's subscription includes these services, while other vendors often rely on warranties with clients and may require third-party upkeep.
- Data Privacy: Review each vendor's data retention and ownership policies to ensure alignment with your organization’s expectations.
Step 3: Design a Controlled Test Environment
To ensure an unbiased comparison, use the following testing protocols and scenarios to guide your benchmark test.
General Testing Protocol
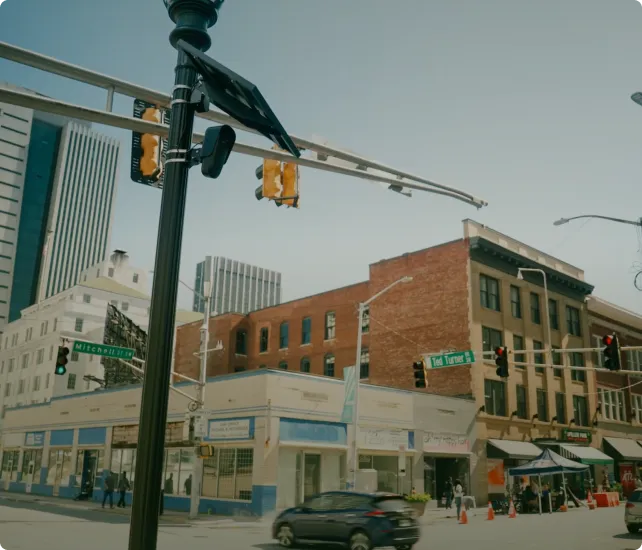
- Camera Setup: Install both cameras in close proximity, ensuring they capture the same lanes of traffic under identical conditions.
- Vehicle Fleet: Ensure vehicles monitored include different types, colors, and characteristics like bumper stickers and roof racks.
- Unbiased Evaluation: Assign team members who are new users of each system to minimize vendor bias.
- Testing Conditions: Choose testing windows to represent results in varied lighting and weather conditions.
- Daytime: Bright, direct sunlight to test for glare and clarity.
- Nighttime: Low light and complete darkness to test infrared performance and low-light legibility.
- Adverse Conditions: Test during rain or fog to evaluate performance in inclement weather
- Daytime: Bright, direct sunlight to test for glare and clarity.
Step 4: Conduct Your LPR Benchmark Test
To streamline your data collection, use this testing template to record your results.
Conclusion: Making Your Decision
At the end of your trial, you’ll have a data-driven view of how each solution performs. The right choice will be the one that meets your technical requirements, fits your budget and infrastructure, and supports your public safety goals.
Should you have any questions or require further guidance on conducting your trial, do not hesitate to reach out to your contact at Flock Safety for support.
A Guide to Benchmarking Fixed LPR Solutions
Choosing the right license plate recognition (LPR) solution starts with a real-world trial. This guide gives you a clear framework to run a side-by-side benchmark so you can compare performance using tangible, measurable results.
Step 1: Define Your Success Metrics
Before beginning your trial, clearly define what success looks like for your organization. While many vendors offer advanced LPR solutions, their approaches to vehicle recognition, data integration, deployment, and ecosystem design often differ. Center your evaluation on these key areas:
- Plate Read Accuracy & Vehicle Identification: Which system delivers more accurate reads and reliably identifies details such as make, color, and unique features?
- Ease of Use & Workflow Integration: How intuitive is the software for searching, analyzing, and sharing data across teams and agencies?
- Deployment & Maintenance: Considering power, connectivity and support, which solution offers the more efficient, cost-effective model for deployment and upkeep?
A Closer Look: How LPR Systems Work
Modern LPR systems capture and analyze vehicle data to generate actionable intelligence. The process works in three key steps:
- Image Capture: High-resolution cameras capture images of vehicles and license plates 24/7.
- Data Analysis: Software powered by optical character recognition (OCR), AI and machine learning reads the plate and identifies details like make, body type, color, condition, and other distinguishing markers.
- Alerts & Investigations: Captured data is checked against hotlists, triggering alerts when matches occur. All data is stored in a searchable database to support investigations.
Step 2: Identify Key Testing Criteria
A focused trial will deliver the most valuable insights. Prioritize the following areas:
Hardware Performance
- Image Quality: Test plate legibility and image clarity across conditions (day, night, weather, glare).
- Read Accuracy: Measure capture rate and accuracy at varying vehicle speeds and across plate types (standard, temporary, vanity).
- Vehicle Recognition: Evaluate how reliably the system identifies make, color, and unique features (e.g., roof racks, bumper stickers).
Software & Analytics
- Search: Test ease and speed when searching by full, partial, or missing plates, as well as temporary or out-of-state plates and vehicle characteristics.
- Data Sharing: Review inter-agency sharing workflows. Many vendors require one-off agency-to-agency agreements; Flock offers a simple opt-in to its nationwide network.
- Reporting: Evaluate the depth and usability of analytics and reporting tools.
Implementation & Support
- Deployment: Compare the permitting and installation processes. Flock’s subscription includes cellular connectivity, permitting and installation; others may require hardware purchase and third-party integrators.
- Maintenance: Clarify responsibilities for maintenance, repairs, and updates. Flock's subscription includes these services, while other vendors often rely on warranties with clients and may require third-party upkeep.
- Data Privacy: Review each vendor's data retention and ownership policies to ensure alignment with your organization’s expectations.
Step 3: Design a Controlled Test Environment
To ensure an unbiased comparison, use the following testing protocols and scenarios to guide your benchmark test.
General Testing Protocol
- Camera Setup: Install both cameras in close proximity, ensuring they capture the same lanes of traffic under identical conditions.
- Vehicle Fleet: Ensure vehicles monitored include different types, colors, and characteristics like bumper stickers and roof racks.
- Unbiased Evaluation: Assign team members who are new users of each system to minimize vendor bias.
- Testing Conditions: Choose testing windows to represent results in varied lighting and weather conditions.
- Daytime: Bright, direct sunlight to test for glare and clarity.
- Nighttime: Low light and complete darkness to test infrared performance and low-light legibility.
- Adverse Conditions: Test during rain or fog to evaluate performance in inclement weather
- Daytime: Bright, direct sunlight to test for glare and clarity.
Step 4: Conduct Your LPR Benchmark Test
To streamline your data collection, use this testing template to record your results.
Conclusion: Making Your Decision
At the end of your trial, you’ll have a data-driven view of how each solution performs. The right choice will be the one that meets your technical requirements, fits your budget and infrastructure, and supports your public safety goals.
Should you have any questions or require further guidance on conducting your trial, do not hesitate to reach out to your contact at Flock Safety for support.


Ready to Discover a Better Approach?
Let’s discuss how Flock Safety’s evidence-based approach can help your area without overstepping boundaries.